Abstract
Augmenting sports videos with data visualizations is gaining traction given its ability to communicate insights and explicate playerstrategies engagingly. However, creating such augmented videos is challenging, as it requires considerable domain expertise in sportsanalytics and video editing skills. To ease the creation process, we present a design space to characterize augmented sports videosat element- (what are the constituents) and clip-levels (how the constituents are organized) by systematically reviewing 233 examplescollected from TV channels, teams, and leagues. The design space provides guidance for selecting data insights and visualizations forvarious purposes. Informed by the design space, we present VisCommentator that facilitates the creation of augmented videos fortable tennis with data insights and visualizations recommendations. A user study with seven domain experts confirms the usefulnessand effectiveness of the system. Another study with sports fans found the resulting videos informative and engaging.
Demo Application
Currently, online demo is not available due to the hardware limited (e.g., GPU required). Source code will be released once paper accepted.Examples
Corpus
Design Space
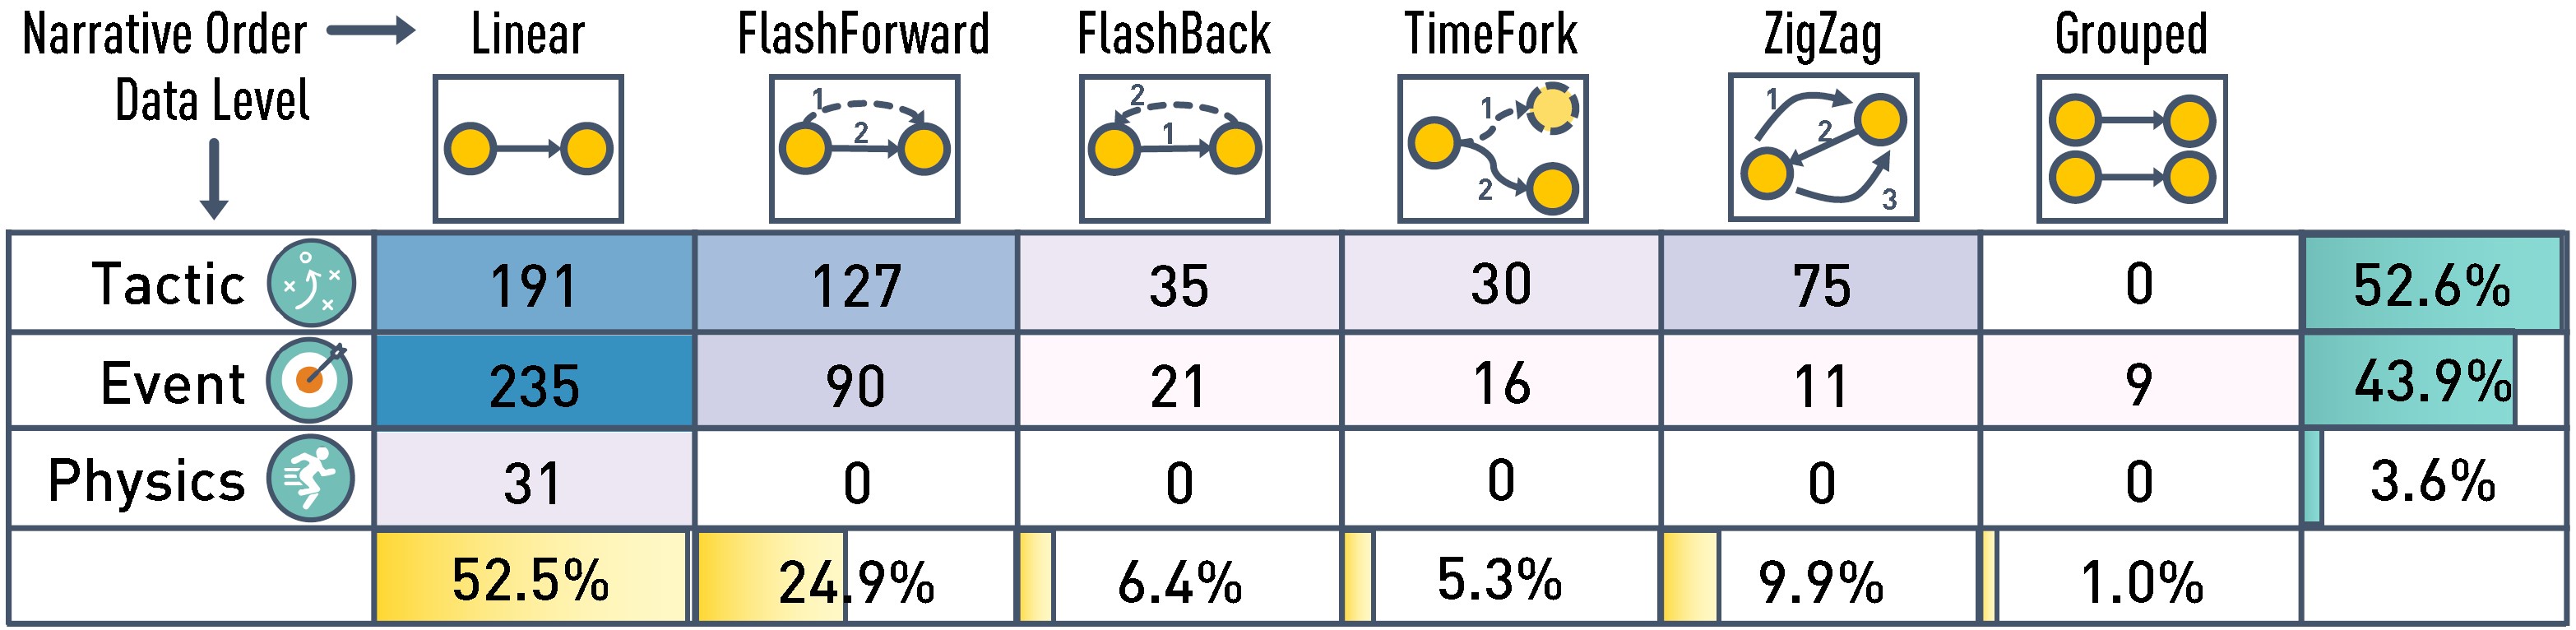
| Narrative | Data Level | Data Type | point | line | area | glyph | label | content | progress | camera |
| Linear | event | kinematics | 484 | 223 | 0 | 83 | 20 | 11 | 15 | 19 |
| playerdistance | 0 | 73 | 0 | 3 | 67 | 0 | 0 | 1 | ||
| playerarea | 0 | 0 | 39 | 0 | 0 | 0 | 0 | 0 | ||
| playertext | 0 | 0 | 0 | 0 | 107 | 0 | 0 | 0 | ||
| courtarea | 0 | 8 | 63 | 0 | 4 | 0 | 0 | 0 | ||
| playeraction | 11 | 2 | 0 | 85 | 177 | 2 | 461 | 67 | ||
| playerformation | 3 | 66 | 20 | 6 | 21 | 0 | 9 | 1 | ||
| ballevent | 50 | 15 | 15 | 12 | 3 | 0 | 7 | 0 | ||
| object | kinematics | 45 | 16 | 0 | 4 | 3 | 2 | 2 | 1 | |
| playerdistance | 0 | 1 | 0 | 0 | 8 | 0 | 0 | 0 | ||
| playerarea | 0 | 1 | 7 | 0 | 0 | 0 | 0 | 1 | ||
| playertext | 0 | 0 | 0 | 0 | 12 | 0 | 1 | 0 | ||
| Flash Forward | event | kinematics | 208 | 230 | 0 | 24 | 12 | 77 | 6 | 8 |
| playerdistance | 1 | 40 | 0 | 1 | 45 | 0 | 0 | 0 | ||
| playerarea | 0 | 0 | 22 | 0 | 0 | 0 | 0 | 0 | ||
| playertext | 0 | 0 | 0 | 0 | 16 | 0 | 0 | 0 | ||
| courtarea | 0 | 3 | 24 | 0 | 1 | 1 | 0 | 0 | ||
| playeraction | 0 | 1 | 0 | 23 | 44 | 5 | 222 | 22 | ||
| playerformation | 1 | 19 | 5 | 1 | 8 | 0 | 3 | 0 | ||
| ballevent | 69 | 10 | 51 | 3 | 8 | 0 | 0 | 0 | ||
| object | kinematics | 12 | 13 | 0 | 0 | 0 | 6 | 0 | 0 | |
| playerarea | 0 | 0 | 1 | 0 | 0 | 0 | 0 | 0 | ||
| playertext | 0 | 0 | 0 | 0 | 1 | 0 | 0 | 0 | ||
| Flash Backward | event | kinematics | 34 | 29 | 0 | 9 | 1 | 0 | 6 | 0 |
| playerdistance | 0 | 2 | 0 | 0 | 0 | 0 | 0 | 0 | ||
| playerarea | 0 | 0 | 4 | 0 | 0 | 0 | 0 | 0 | ||
| playertext | 0 | 0 | 0 | 0 | 6 | 0 | 0 | 0 | ||
| courtarea | 0 | 3 | 0 | 0 | 0 | 0 | 0 | 0 | ||
| playeraction | 0 | 1 | 0 | 5 | 11 | 0 | 106 | 20 | ||
| playerformation | 0 | 3 | 0 | 0 | 0 | 0 | 0 | 0 | ||
| ballevent | 5 | 0 | 0 | 0 | 4 | 0 | 0 | 0 | ||
| object | kinematics | 1 | 1 | 0 | 0 | 0 | 0 | 0 | 0 | |
| playerarea | 0 | 0 | 2 | 0 | 0 | 0 | 0 | 0 | ||
| ZigZag | event | kinematics | 129 | 31 | 0 | 9 | 0 | 2 | 4 | 1 |
| playerdistance | 0 | 2 | 0 | 0 | 1 | 0 | 0 | 0 | ||
| playerarea | 1 | 0 | 13 | 0 | 0 | 0 | 0 | 0 | ||
| playertext | 0 | 0 | 0 | 0 | 6 | 0 | 0 | 0 | ||
| courtarea | 0 | 5 | 6 | 0 | 1 | 0 | 0 | 0 | ||
| playeraction | 0 | 0 | 0 | 1 | 22 | 0 | 182 | 27 | ||
| playerformation | 0 | 3 | 1 | 0 | 0 | 0 | 0 | 0 | ||
| ballevent | 3 | 0 | 0 | 0 | 0 | 0 | 0 | 0 | ||
| Grouped | event | kinematics | 8 | 6 | 0 | 3 | 2 | 0 | 1 | 0 |
| playerdistance | 0 | 4 | 0 | 0 | 3 | 0 | 0 | 0 | ||
| playerarea | 0 | 0 | 0 | 0 | 0 | 0 | 0 | 0 | ||
| playertext | 0 | 0 | 0 | 0 | 1 | 0 | 0 | 0 | ||
| courtarea | 0 | 1 | 1 | 0 | 0 | 0 | 0 | 0 | ||
| playeraction | 0 | 0 | 0 | 2 | 2 | 0 | 6 | 5 | ||
| playerformation | 0 | 2 | 0 | 0 | 0 | 0 | 0 | 0 | ||
| ballevent | 2 | 0 | 2 | 0 | 0 | 0 | 0 | 0 | ||
| TimeFolk | event | kinematics | 56 | 22 | 0 | 0 | 0 | 23 | 2 | 2 |
| playerdistance | 0 | 3 | 0 | 0 | 5 | 0 | 0 | 0 | ||
| playerarea | 0 | 0 | 11 | 0 | 0 | 0 | 0 | 0 | ||
| playertext | 0 | 0 | 0 | 0 | 2 | 0 | 0 | 0 | ||
| courtarea | 0 | 4 | 4 | 0 | 1 | 0 | 0 | 0 | ||
| playeraction | 7 | 11 | 0 | 2 | 5 | 4 | 41 | 6 | ||
| playerformation | 0 | 4 | 1 | 0 | 6 | 0 | 0 | 0 | ||
| ballevent | 3 | 8 | 5 | 0 | 1 | 2 | 0 | 0 | ||
| object | kinematics | 3 | 2 | 0 | 0 | 0 | 5 | 0 | 0 | |
| playerdistance | 0 | 2 | 0 | 0 | 2 | 0 | 0 | 0 |
Machine Learning Library and Code
1. BodyPix2
We use BodyPix2 from google to detect and segment players from a video. BodyPix2 is devloped based on Tensorflow.js and can be ran in NodeJs environments. The hyper-parameters we used are:
// for bodyPix.load { "architecture": "ResNet50", "outputStride": 16, "quantBytes": 4 }// for net.segmentPerson { "flipHorizontal": false, "internalResolution": "full", "segmentationThreshold": 0.7, "maxDetections": 10, "scoreThreshold": 0.2, "nmsRadius": 20, "minKeypointScore": 0.3, "refineSteps": 10 }
2. Event Recognition
We use spatial temporal graph ConvNet (ST-GCN) [1] to recongize player event such as the technique a player used in one stroke.
2.1. Input & output
According to the pipeline porposed in ST-GCN, we first collect the table tennis video with high resolution (1080p) and frame rate (50fps). Then we use the pose estimation algorithm to retrieve the body joints from each frame, and formulate the spatial graph where the node is the joint and edge is the connection between joints of a body and joints between adjacent frames. Finally the spatial graph is used as the input for the ST-GCN.
The output of the ST-GCN is the standard SoftMax classifier that identifies the graph into corresponding technique category.
2.2. Training
We kept the the network structure the same as it introduced in the paper [1]. To gather the training data, we collected thousands of strokes from hundreds of world tournament games happened during 2016-2018. These data are manually identified from videos and formulated into structured json file. A sample file fragment is as follows:
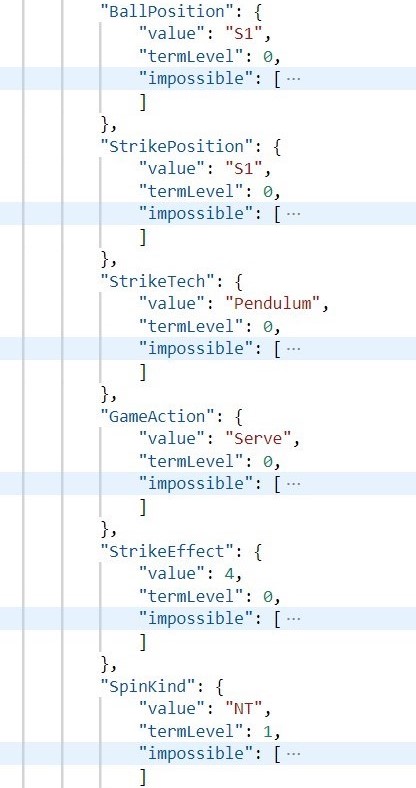
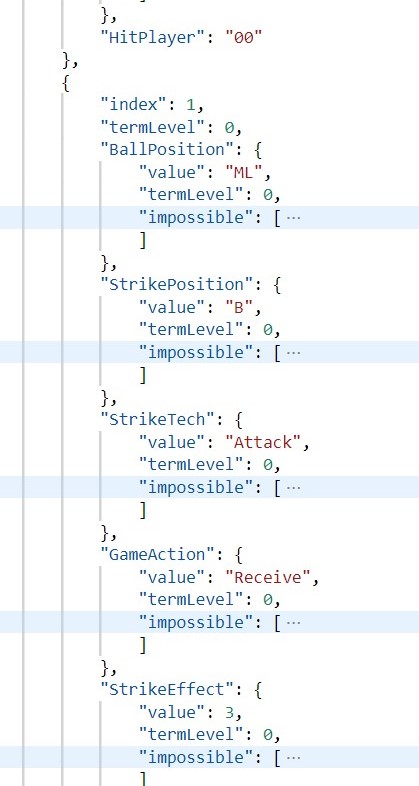
To train the ST-GCN, we kept the number of records (video fragments) in each technique equally to make sure the scale of joints from different categories are almost the same. To this end, we first further devided the records of each technique into two categories: the player face to the screen and the player back to the screen. Then, we grouped the techniques with little records into "other" category, and simply discarded extra records to maintain consistent record numbers for each category. Finally, we got seven techniques (i.e. topspin, reverse, push, short, pendulum, attack, others), 14 categories with 4375 records each.
3. Causality
We use FGES (Fast Greedy Equivalence Search) [2] to extract the recommended data that used for future purpose. The toolkit can be found in [3].
3.1. Input
To generate a causal graph, we group the table tennis data into a table, where each row represents a rally and each column represents a technique. Each cell records the frequency of corresponding technique used in that rally.
Input Table Sample
| Topspin | Reverse | Push | Pendulum | Flick | Lob | Twist | Block | Short | Others | Attack | Smash |
|---|---|---|---|---|---|---|---|---|---|---|---|
| 2 | 0 | 0 | 1 | 0 | 0 | 0 | 0 | 0 | 0 | 1 | 0 |
| 2 | 1 | 0 | 0 | 0 | 0 | 0 | 2 | 1 | 0 | 1 | 0 |
| 0 | 0 | 0 | 1 | 1 | 0 | 0 | 2 | 1 | 0 | 1 | 0 |
| 0 | 0 | 0 | 1 | 1 | 0 | 0 | 2 | 1 | 0 | 1 | 0 |
| 2 | 1 | 0 | 0 | 0 | 0 | 0 | 1 | 0 | 0 | 2 | 1 |
| … | |||||||||||
3.2. Output

References
[1] Yan S, Xiong Y, Lin D. Spatial temporal graph convolutional networks for skeleton-based action recognition[J]. arXiv preprint arXiv:1801.07455, 2018.
[2] Fast Greedy Equivalence Search (FGES) Algorithm for Discrete Variables. Available at: https://www.ccd.pitt.edu/wiki/index.php/Fast_Greedy_Equivalence_Search_(FGES)_Algorithm_for_Discrete_Variables (Accessed: 10 September 2020)
[3] py-causal. Available at: https://github.com/bd2kccd/py-causal (Accessed: 10 September 2020)